Changes to the Analysis Page
The Analysis page has changed in this version. Use this quick reference guide to familiarize yourself with the updated screens and graphs.
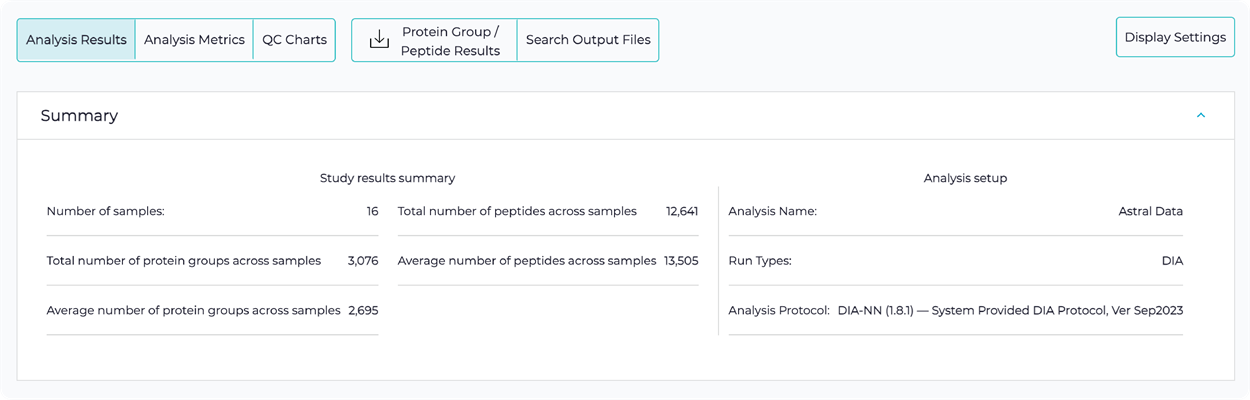
Analysis Results tab
Summary Panel
View a summary of key study results and general analysis setup information.
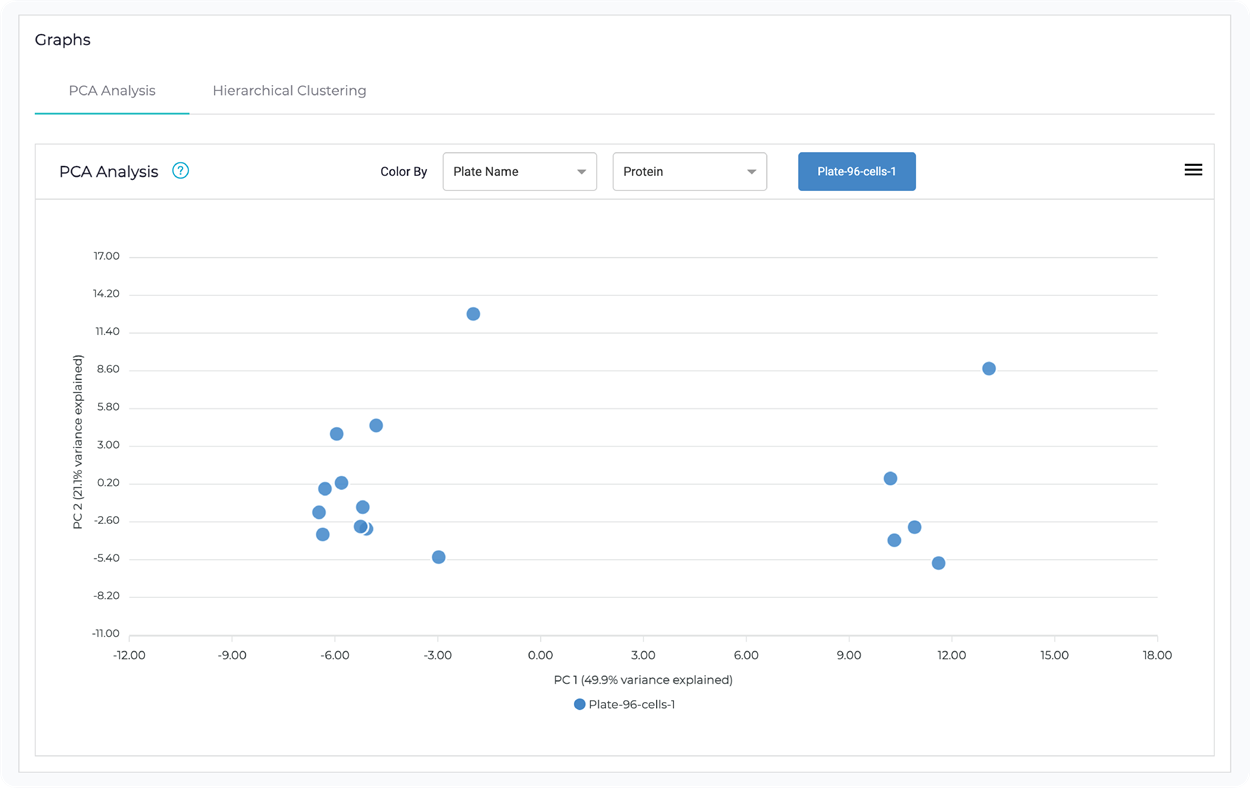
Graphs Panel
Select either PCA Analysis or Hierarchical Clustering for data visualizations.
The PCA Analysis and Hierarchical Clustering graphs will colorize data by assigned custom fields such as Condition, Treatment, and Sex. In cases where there are no assigned custom fields, the dataset will instead display colorization based on the plate name.
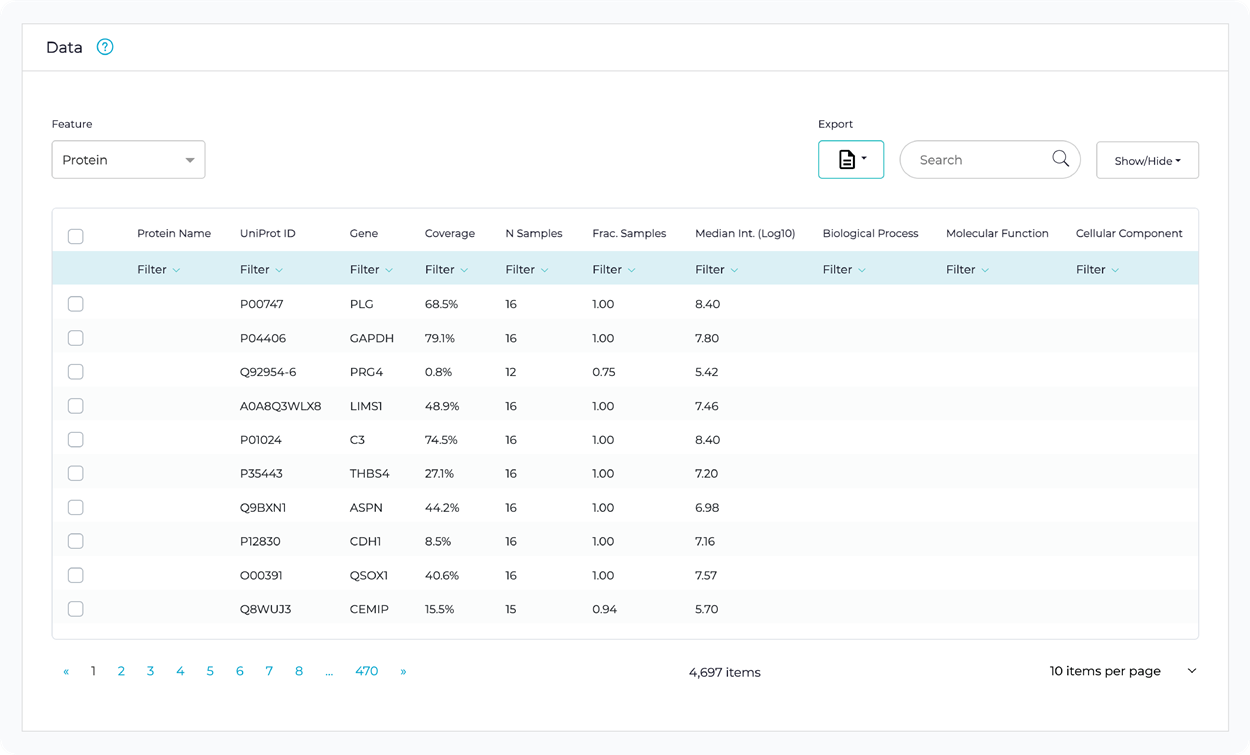
Data Panel
View results for proteins and peptides identified in the search analysis.
Use table filtering and sorting to view data results.
Results includes tabulated data for every protein and peptide identified in the search analysis.
Group Analysis Panel
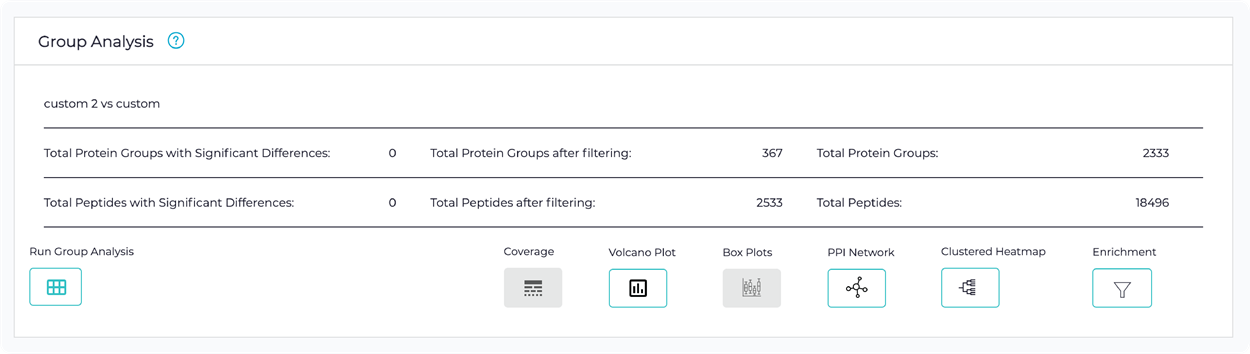
If you are working with grouped data, perform a differential expression analysis by selecting Run Group Analysis. Access group analysis results in the data table and various visualizations.
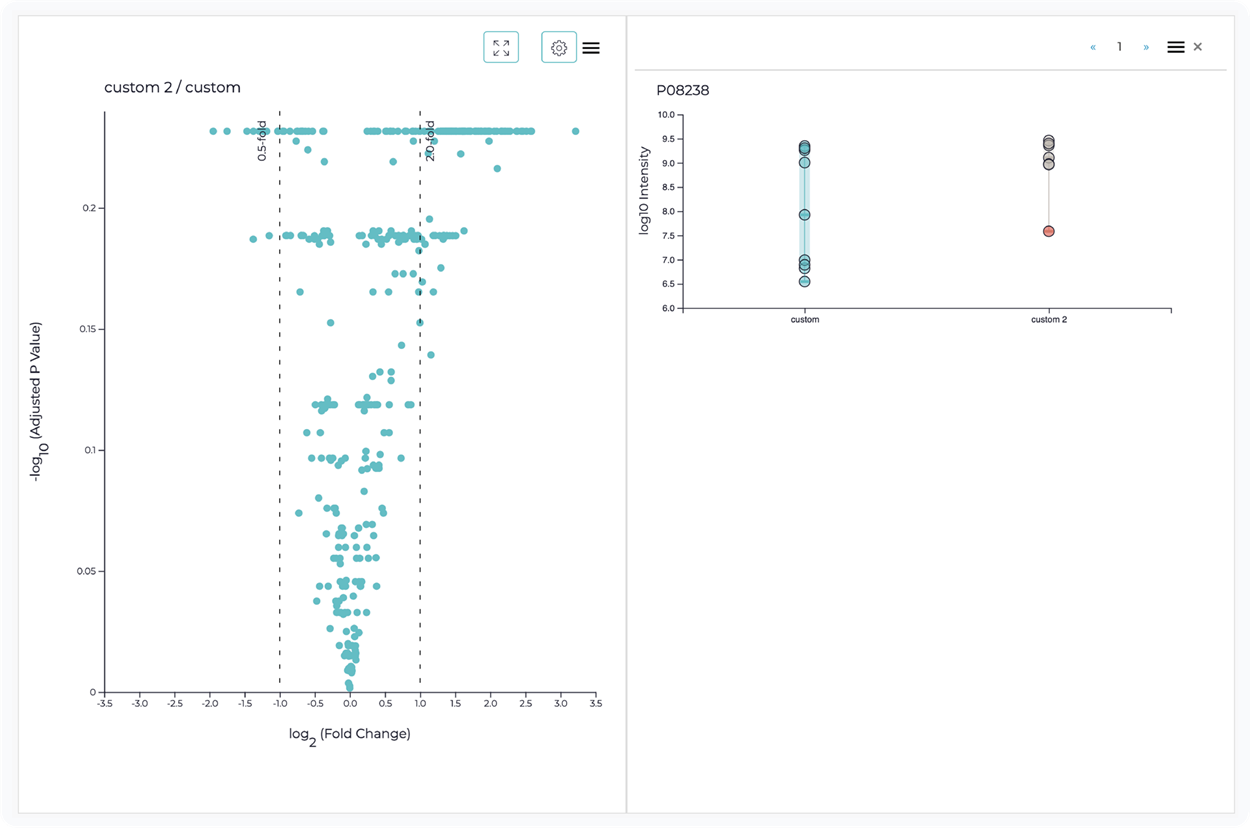
Group Analysis visualizations includes:
Use the display settings to sort or group samples by custom fields.
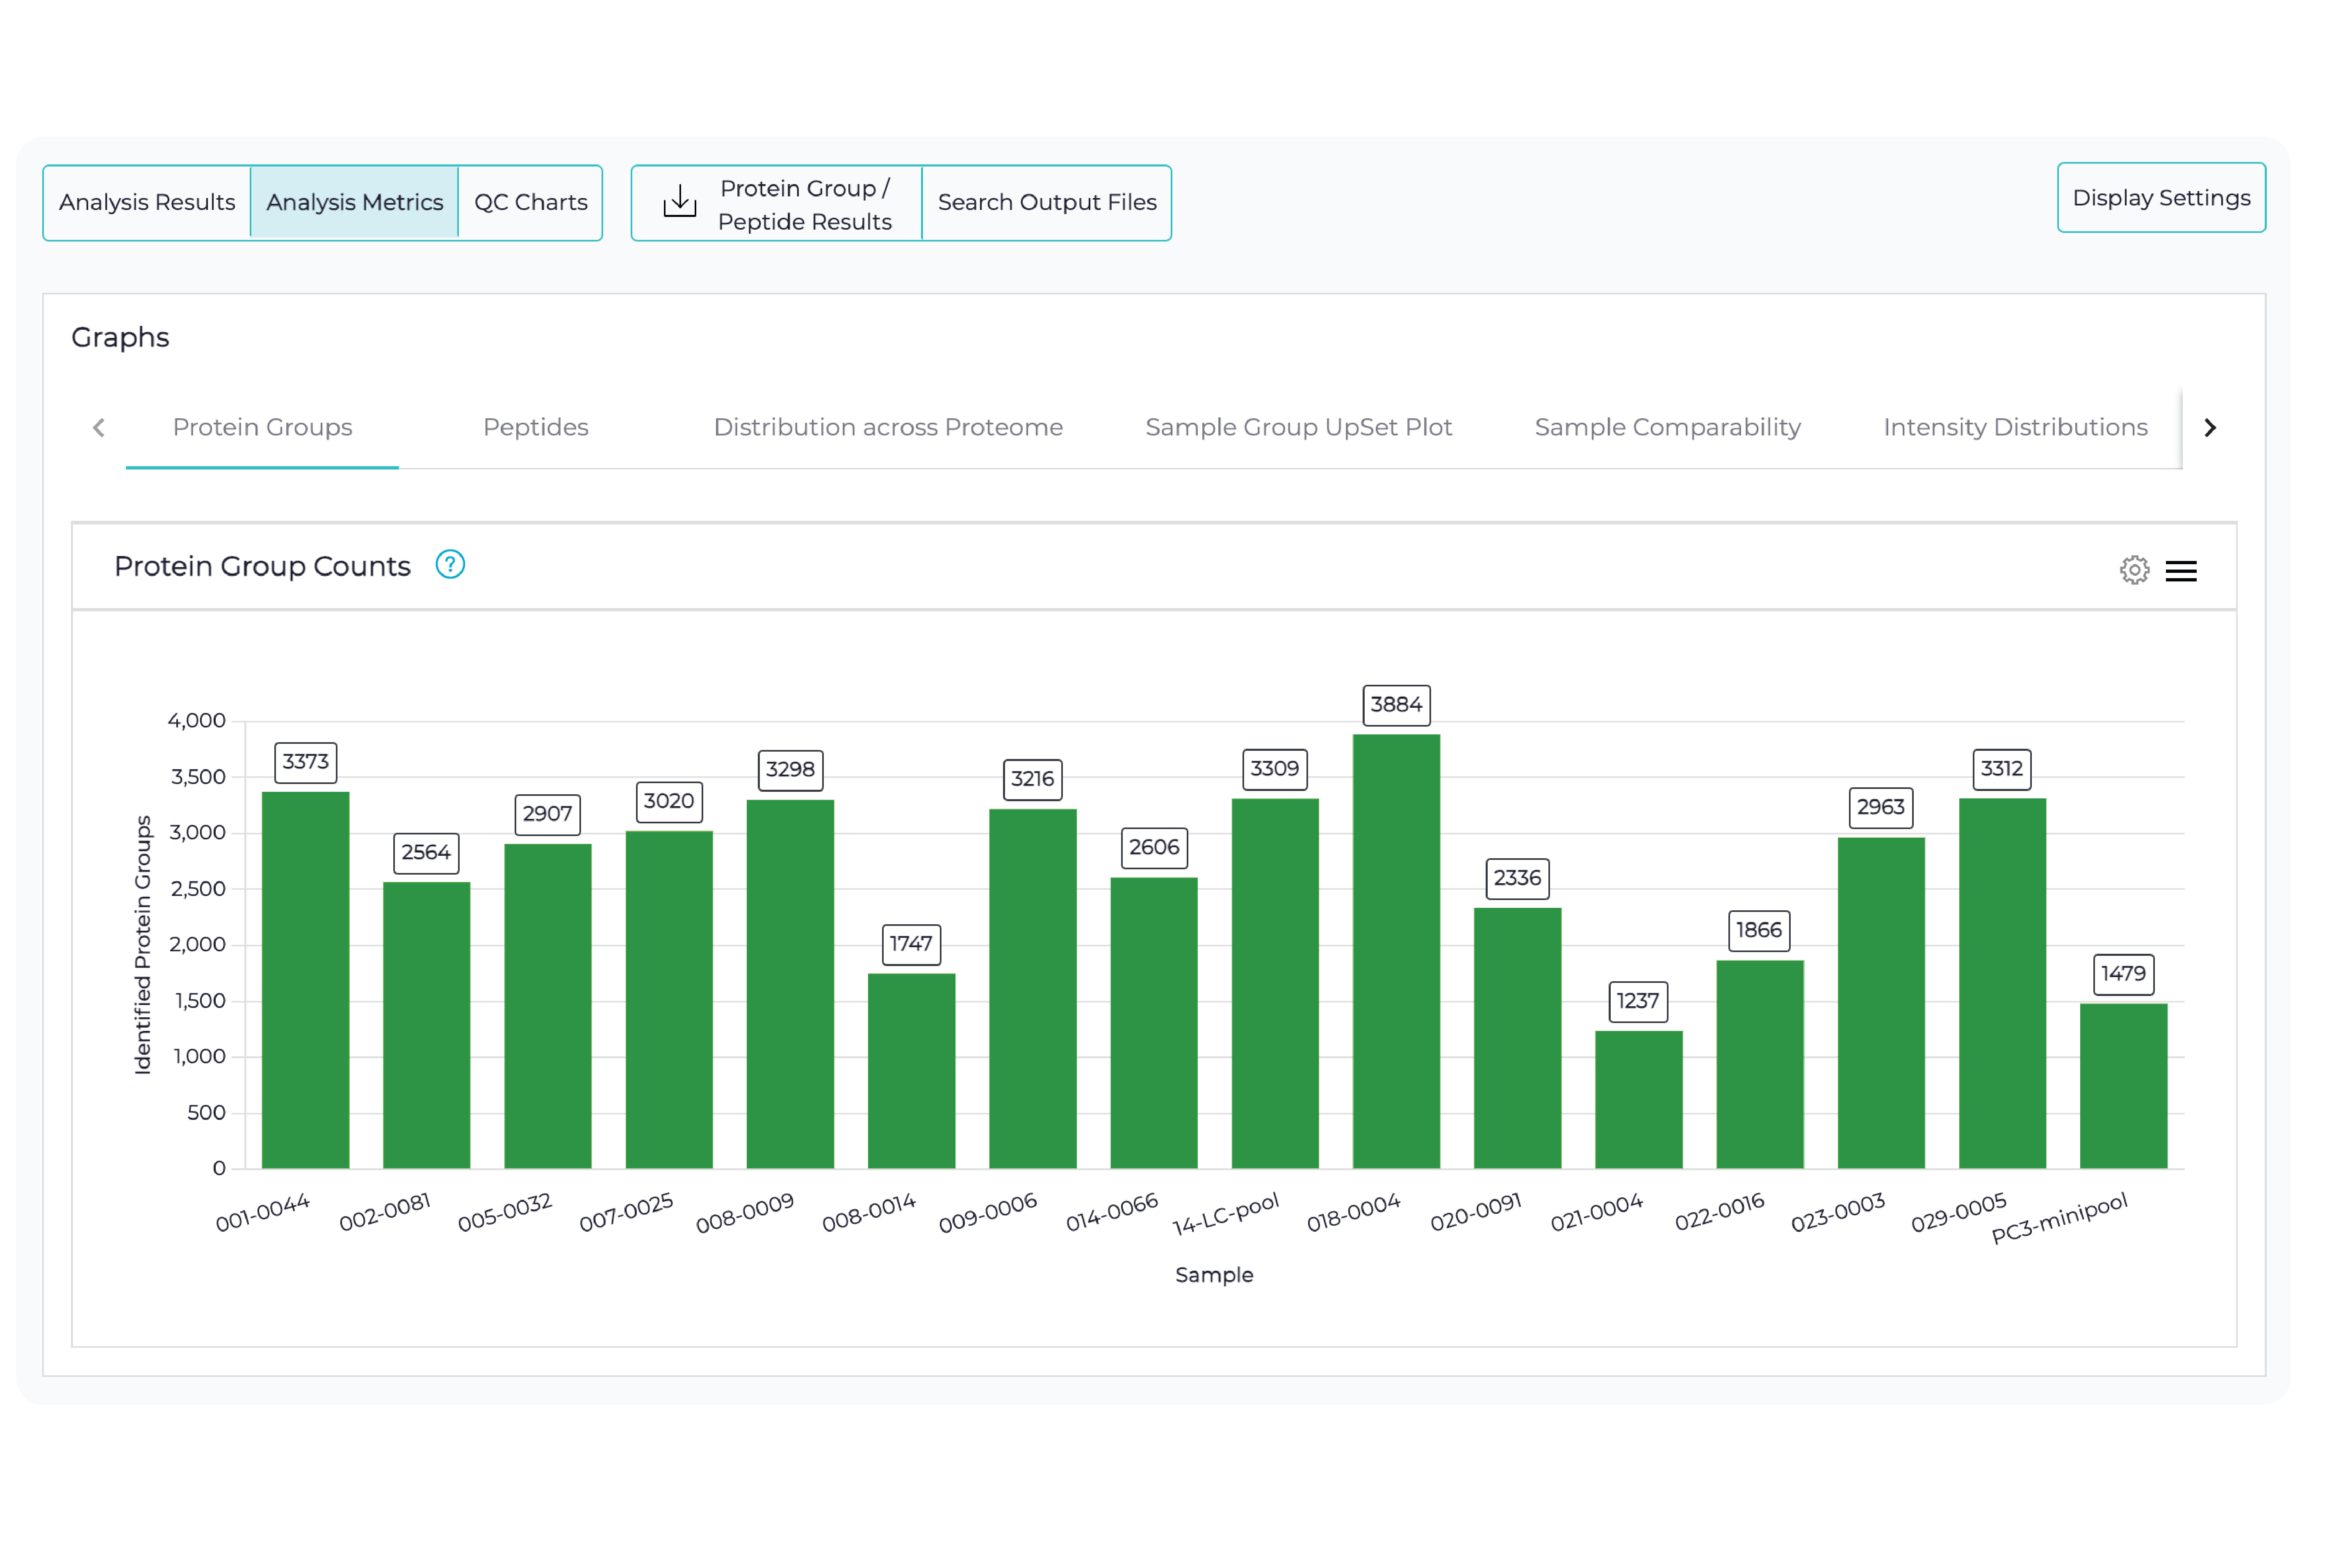
Analysis Metrics tab
Graphs Panel
View analysis data through various visualizations.
Graphs panel visualizations include: