Lamppost Proteins graph
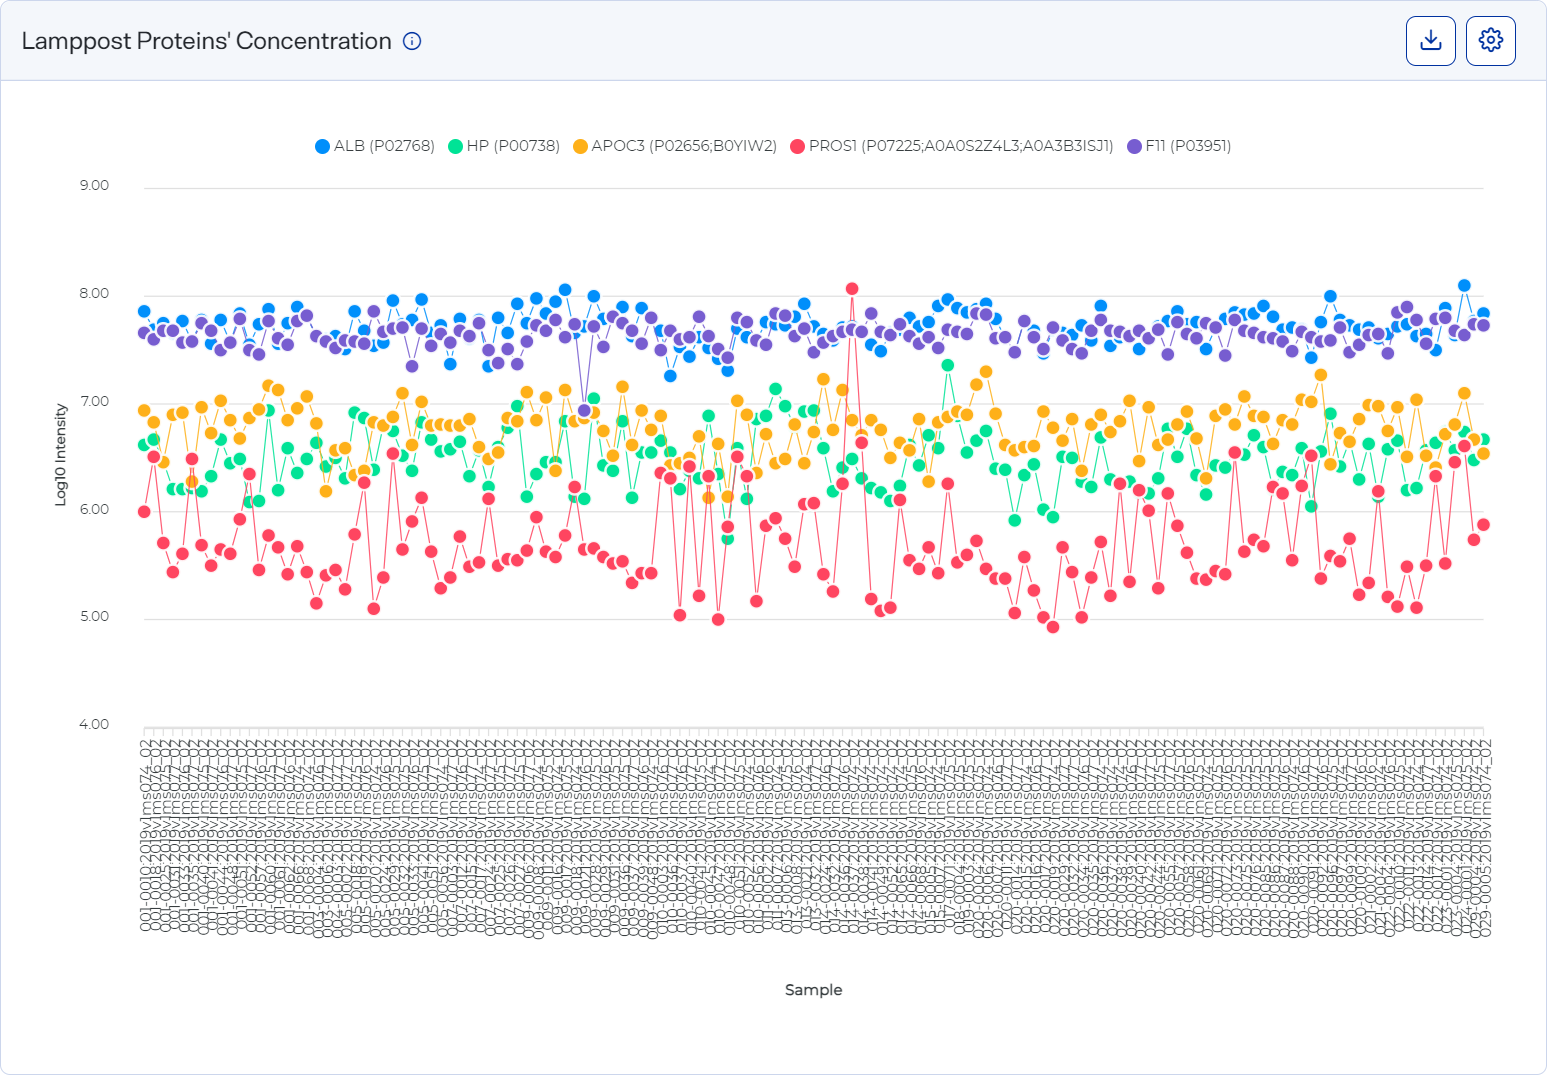
The Lamppost Proteins graph shows the intensity of lamppost proteins in each sample.
The x-axis plots each well and plate and the y-axis plots log10 intensity.
Five lines compare intensities for the proteins HP, APOC3, PROS1, F11, and ALB. Dots along each line identify the intensity value for each protein in the sample.
Line graph showing intensities for lamppost proteins
How to open and use
-
To open this graph, select
 Analyses, select an analysis, and select the Analysis Metrics tab. Then select the Lamppost Proteins tab.
 -
Hover over a dot to view the exact values for all five proteins.
-
Hide a line by selecting its label in the legend. (You many need to scroll right to see the label, which appears above the graph.)
-
Hide all lines except one by hovering over that line’s label in the legend.
-
Select
 button") Settings to customize the graph. See Set preferences for the Lamppost Proteins graph.
Settings to customize the graph. See Set preferences for the Lamppost Proteins graph. -
Download graph data as a .csv file by selecting the CSV option from the
 Download. (You may need to scroll all the way to the right to see the button.)
 -
Download a graph as an image file by selecting an image option from the
Download on the graph.