Peptide/Protein Group Counts of Nanoparticles graphs
The Analysis Metrics tab’s Peptide/Protein Group Counts of Nanoparticles graphs offer show the number of peptides or protein groups counted for each nanoparticle per sample.
These graphs are hidden by default. You can view them by selecting Display Settings, and then selecting the toggle under Visualization Graphs.
-
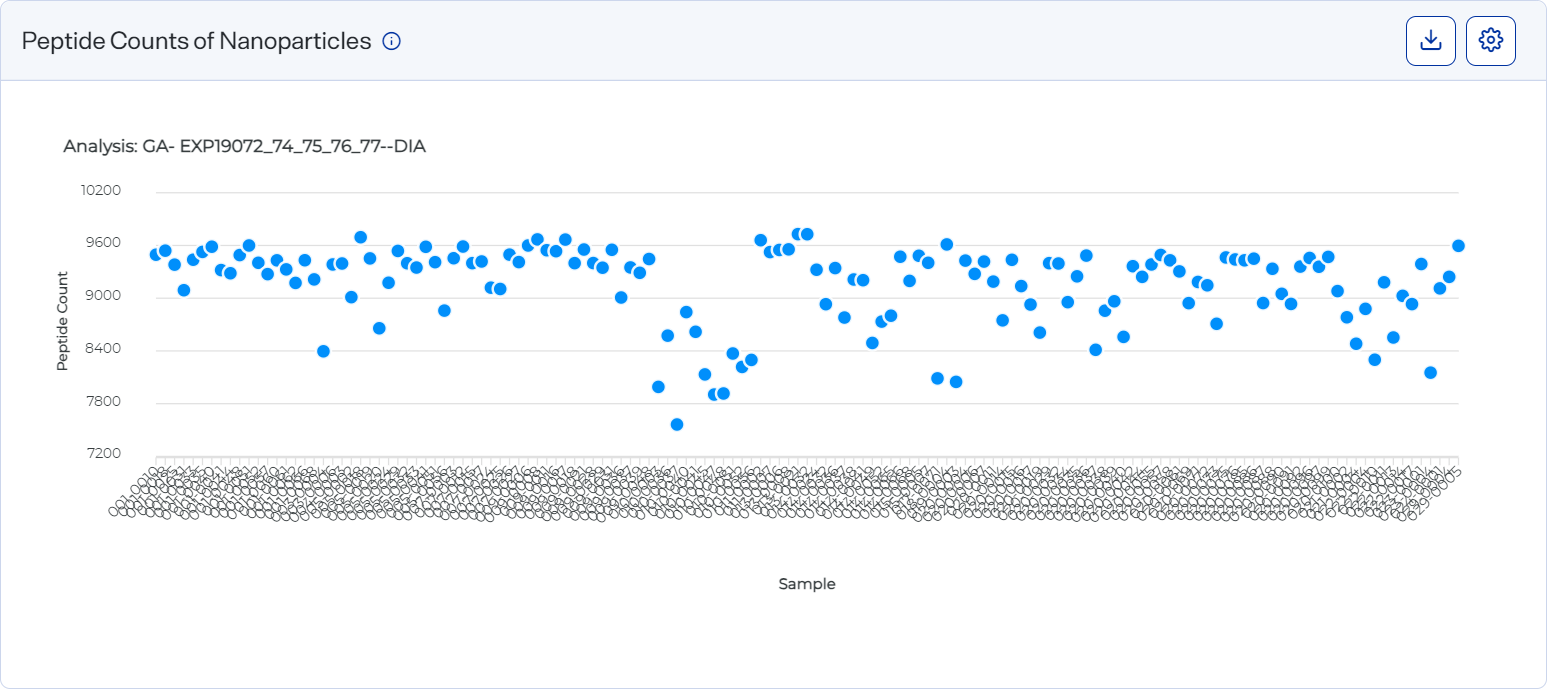
Peptide Counts of Nanoparticles — Shows the sample protein group counts identified by each nanoparticle. Each dot represents a sample. The x-axis plots samples and the y-axis plots the number of peptides.
Scatter plot showing peptide counts of nanoparticles
-
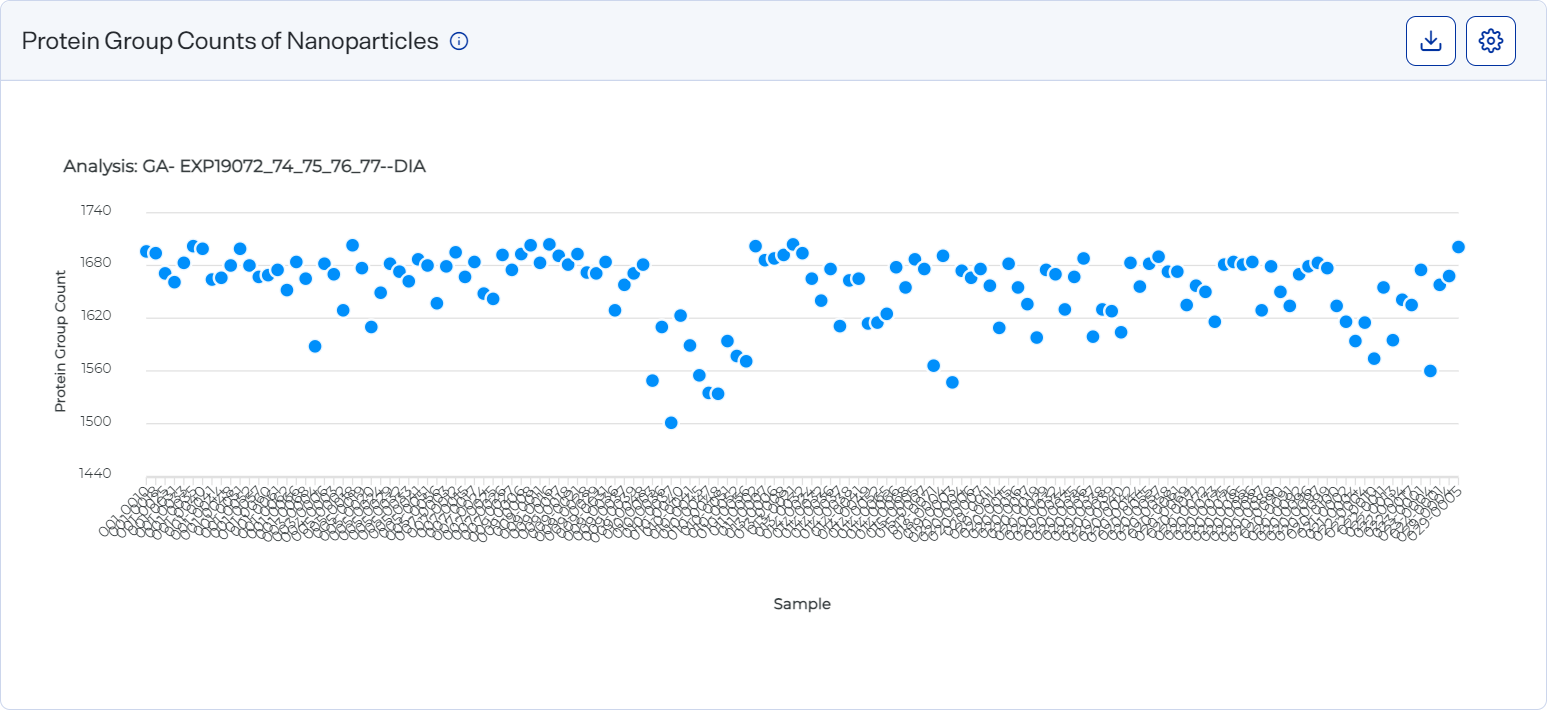
Protein Group Counts of Nanoparticles — Shows the sample peptide counts identified by each nanoparticle. Each dot represents a sample. The x-axis plots samples and the y-axis plots the number of peptides.
Scatter plot showing protein group counts of nanoparticles
How to open and use
-
To open these graphs, select
 Analyses, select an analysis, and select the Analysis Metrics tab. If the graphs are hidden, select Display Settings and then the toggle under Visualization Graphs. Then select the Peptide/Protein Group Counts of Nanoparticles tab.
 -
Hover over a dot to view a well, the nanoparticle that occupies the well, and the peptide count.
-
Remove a well from the plot by selecting its dot under the x-axis.
-
Select
 button") Settings to customize the graph. See Set preferences for the Peptide/Protein Group Counts of Nanoparticles graphs.
Settings to customize the graph. See Set preferences for the Peptide/Protein Group Counts of Nanoparticles graphs. -
Download graph data as a .csv file by selecting the CSV option from the
 Download. (You may need to scroll all the way to the right to see the button.)
 -
Download a graph as an image file by selecting an image option from the
Download on the graph.