Protein Groups graph
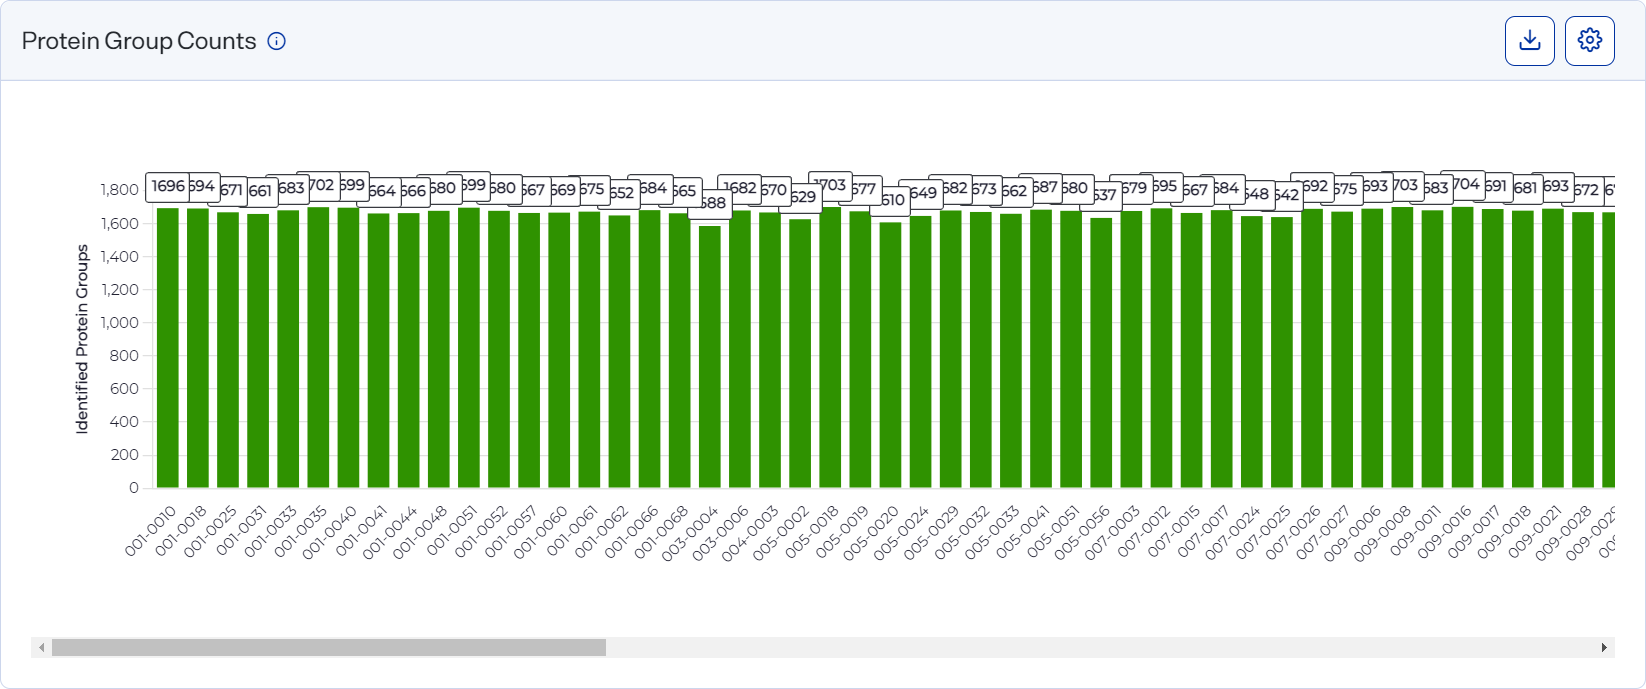
The Protein Groups graph shows the number of proteins in each sample.
The y-axis plots the number of unique identified protein groups in each sample, and the x‑axis plots each well.
Quantity values at the top of each column identify values for each well.
How to open and use
-
To open this graph, select
 Analyses, select an analysis, and select the Analysis Metrics tab. This graph is shown by default.
 -
Hover over a column on the graph to view an exact value.
-
Select
 button") Settings to customize the graph. See Set preferences for the Protein Group Counts graph.
Settings to customize the graph. See Set preferences for the Protein Group Counts graph.Style the graph to include the information you want before downloading it as an image file. The graph reverts to its default settings each time the page loads.
-
Download graph data as a .csv file by selecting the CSV option from the
 Download.
 -
Download a graph as an image file by selecting an image option from the
Download on the graph.