Plate Views graphs
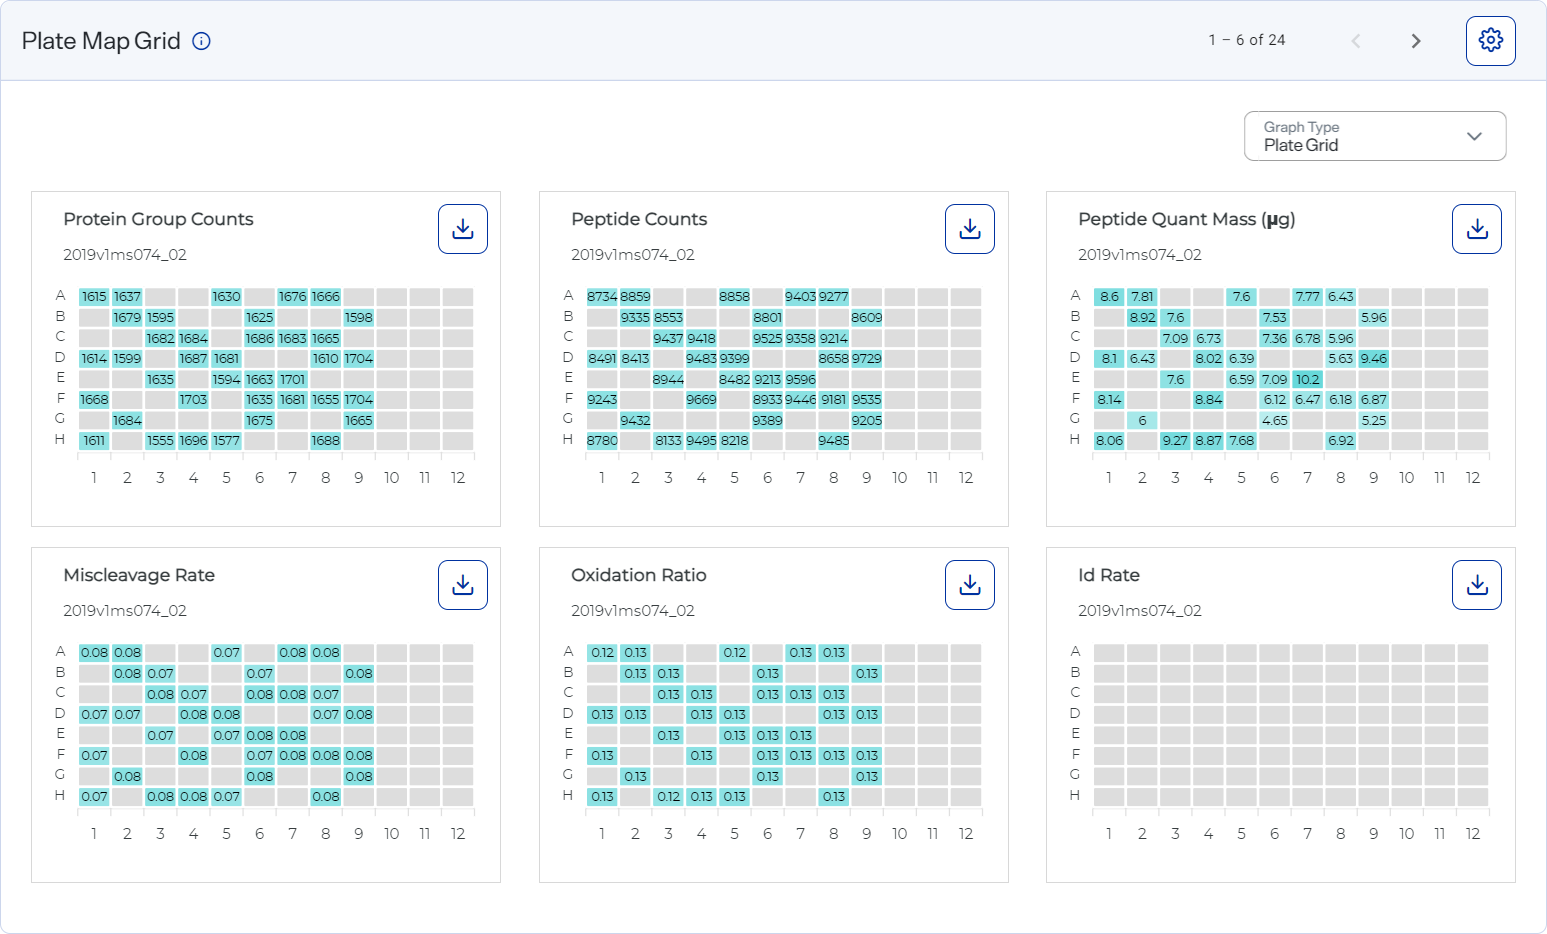
The Plate Views graphs show metrics for the individual samples in the format of 96-well plates.
The default chart type is a plate grid, which you can change to a scatter plot.
Each plate represents one of the following metrics. Hover over a well to view the value. Alternatively, you can consolidate these data into a single scatter plot.
-
Protein group counts — The number of protein groups identified per well.
-
Peptide counts — The number of peptides identified per well.
-
Peptide quant mass — The mass of peptide in the well as calculated by the peptide quantification assay.
-
Miscleavage rate — The fraction of peptides identified as having missed cleavages based on the maximum allowable missed cleavages set in the analysis protocol.
-
Oxidation ratio — The fraction of peptides identified with methionine oxidation.
-
ID rate — The rate at which an MS/MS scan is converted into a database peptide identification.
Grids for each metric showing results for each sample
How to open and use
-
To open this graph, select
 Analyses, select an analysis, and select the Analysis Metrics tab. Then select the Plate Views tab.
 -
Use the scroll arrows and page numbers to move through all the graphs.
-
For a plate grid, hover over a well to see its value.
-
For a scatter plot:
-
Hover over a dot to view an exact value.
-
Hide a line by selecting its label in the legend.
-
Hide all lines except one by hovering over that line’s label in the legend.
-
-
Select
 button") Settings to customize the graph. See Set preferences for Plate Views graphs.
Settings to customize the graph. See Set preferences for Plate Views graphs.Style the graph to include the information you want before downloading it as an image file. The graph reverts to its default settings each time the page loads.
-
Download graph data as a .csv file by selecting the CSV option from the
 Download.
 -
Download a graph as an image file by selecting an image option from the
Download on the graph.