Peptide/Protein Groups Distributions graphs
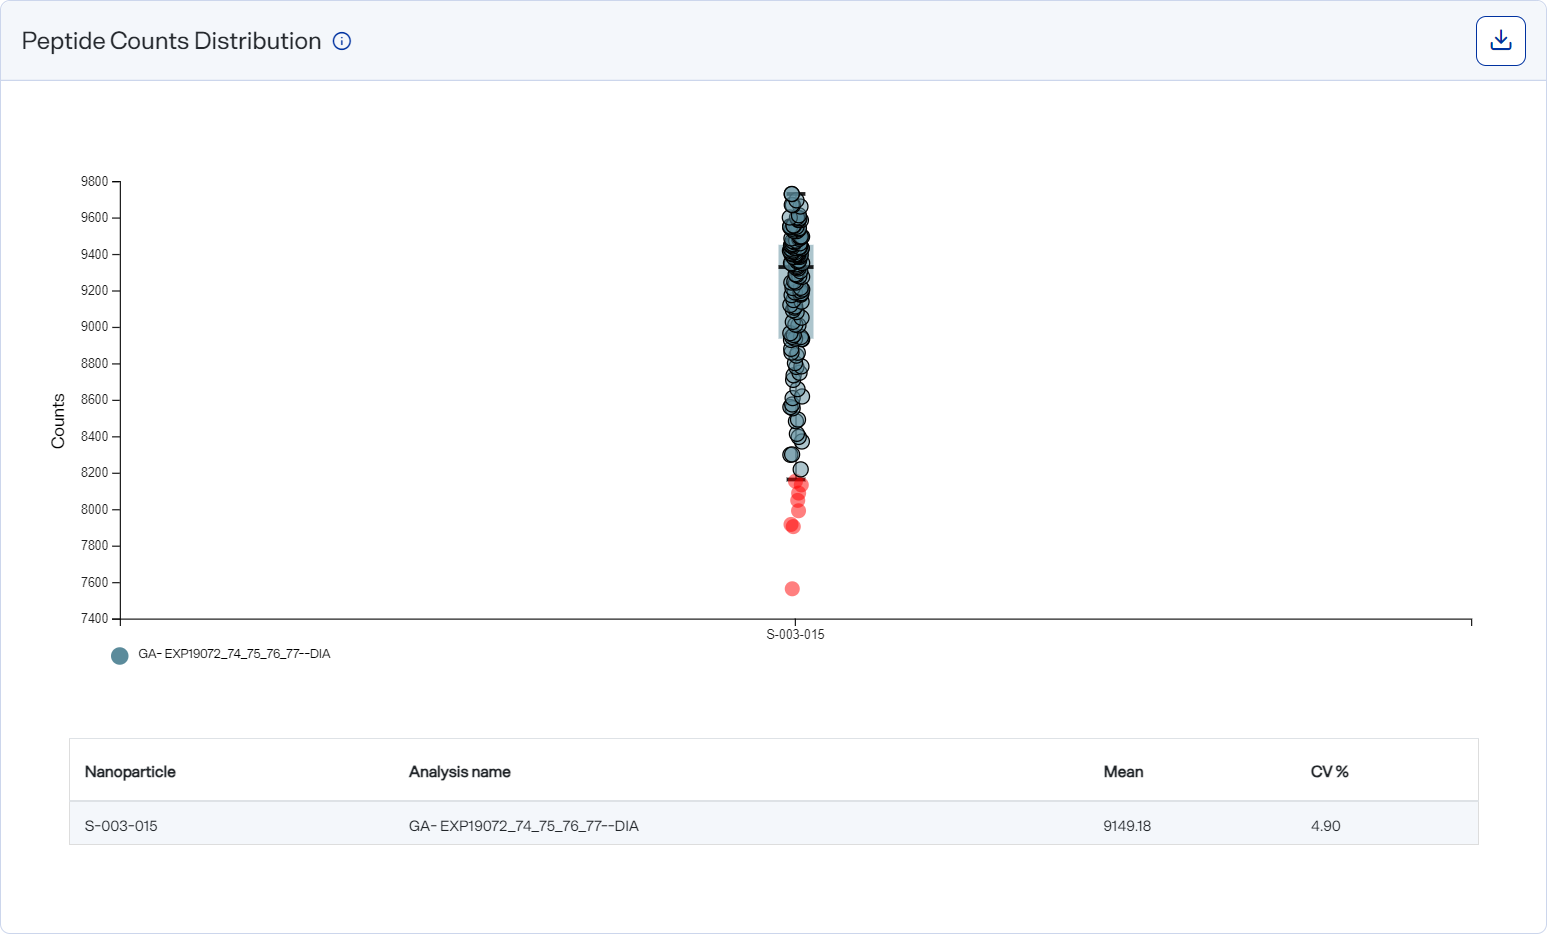
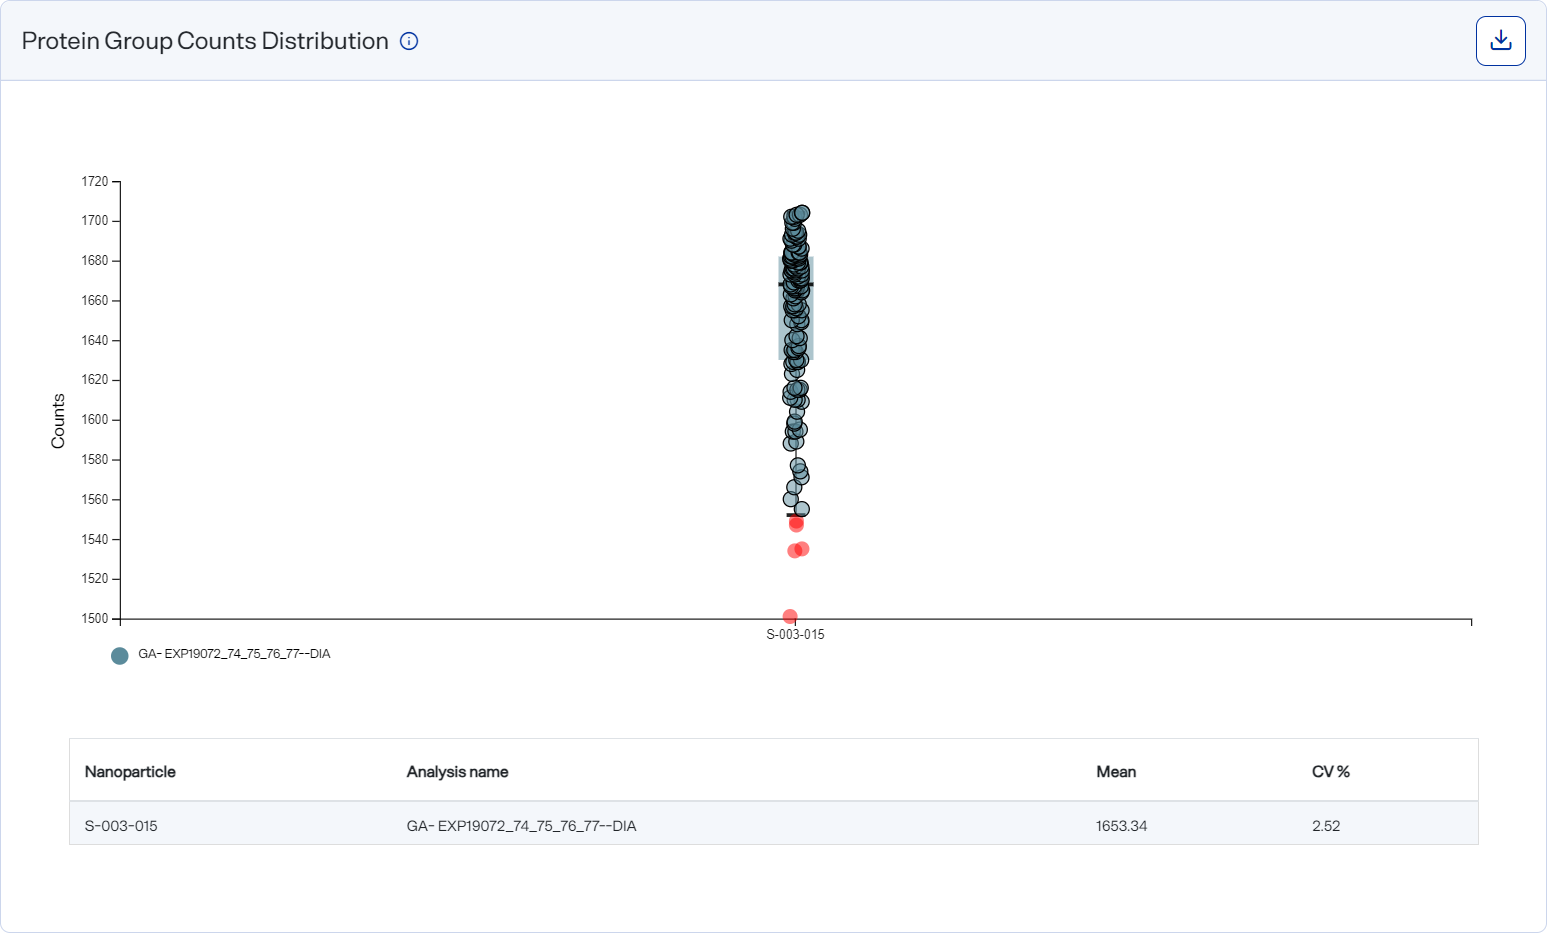
The Peptide/Protein Groups Distributions graphs show the peptide and protein counts for the five nanoparticles as box plots.
These graphs are hidden by default. You can view them by selecting Display Settings, and then selecting the toggle under Visualization Graphs.
A table below each plot shows the analysis name, mean value, and CV percentage for each nanoparticle. Each box plot and table represent one plate.
Box plots showing peptides distribution
Box plots showing protein groups distribution
How to open and use
-
To open these graphs, select
 Analyses, select an analysis, and select the Analysis Metrics tab. If the graphs are hidden, select Display Settings and then the toggle under Visualization Graphs. Then select the Peptide/Protein Group Counts Distribution tab.
 -
Hover over a dot to view the peptide or protein count, file, and sample name.
-
Hover over a box to view the quantile for the nanoparticle.
-
Download graph data as a .csv file by selecting the CSV option from
 Download.
 -
Download a graph as an image file by selecting an image option from the
Download on the graph.