Sample Group UpSet Plots graph
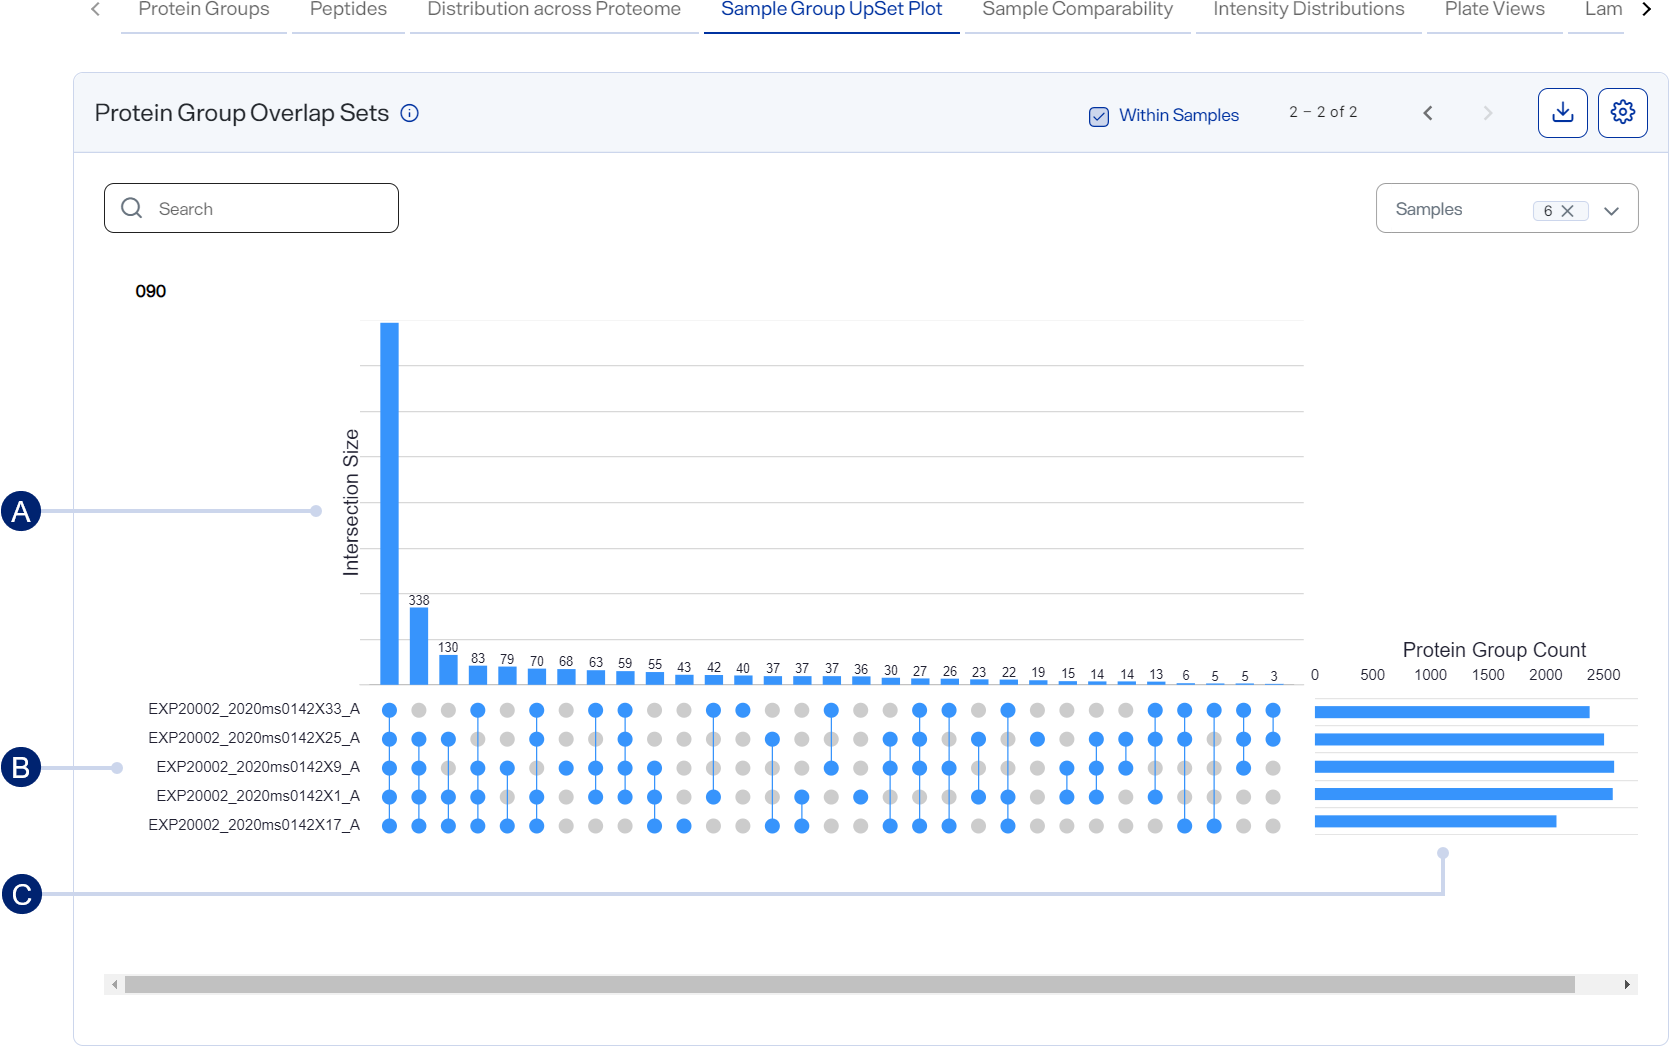
The Sample Group UpSet Plots graph is divided into two bar graphs and a matrix that together show protein group intersections.
The Within Samples checkbox shows intersection size and protein group count as standalone graphs for each sample with a dot representing the MS data file.
Graphs and a matrix show protein group overlaps
-
Intersection Size bar graph
-
Matrix
-
Protein Group Count bar graph
How to open and use
-
To open this graph, select
 Analyses, select an analysis, select the Analysis Results tab, and scroll down to the Graphs section. Then select the Protein Group Upsets tab.
 -
Hover over a vertical bar to view the intersection size for the group of samples as an integer and the percentage of the total it represents.
-
Hover over a horizontal bar to view the sample and the exact number of protein groups it contains.
-
Select or clear wells in the Samples list to show or hide their corresponding bars.
-
Find specific graphs by entering a keyword or term in the Search field.
-
Use the scroll arrows and page numbers to move through all the graphs.
-
Select
 button") Settings to customize the graph. See Set preferences for the Sample Group UpSet Plots graph.
Settings to customize the graph. See Set preferences for the Sample Group UpSet Plots graph.Style the graph to include the information you want before downloading it as an image file. The graph reverts to its default settings each time the page loads.
-
Download graph data as a .csv file by selecting the CSV option from
 Download.
 -
Download the graph as an image file by selecting an image option from
Download.