Group Analysis panel
The Group Analysis panel (on the Analyses page) shows the analysis and results from comparing two user-defined groups, organized into sections. You can visualize differences in proteins detected between the groups and explore initial biological insights into the data.
Samples must be annotated with at least two conditions. You can add or modify conditions in your sample description file or by editing samples in the relevant plates on the Plates page.
-
Run Group Analysis — Select to set up groups and start a comparative analysis. See Run a group analysis.
You can also choose to re-run a completed group analysis with the option to select different settings.
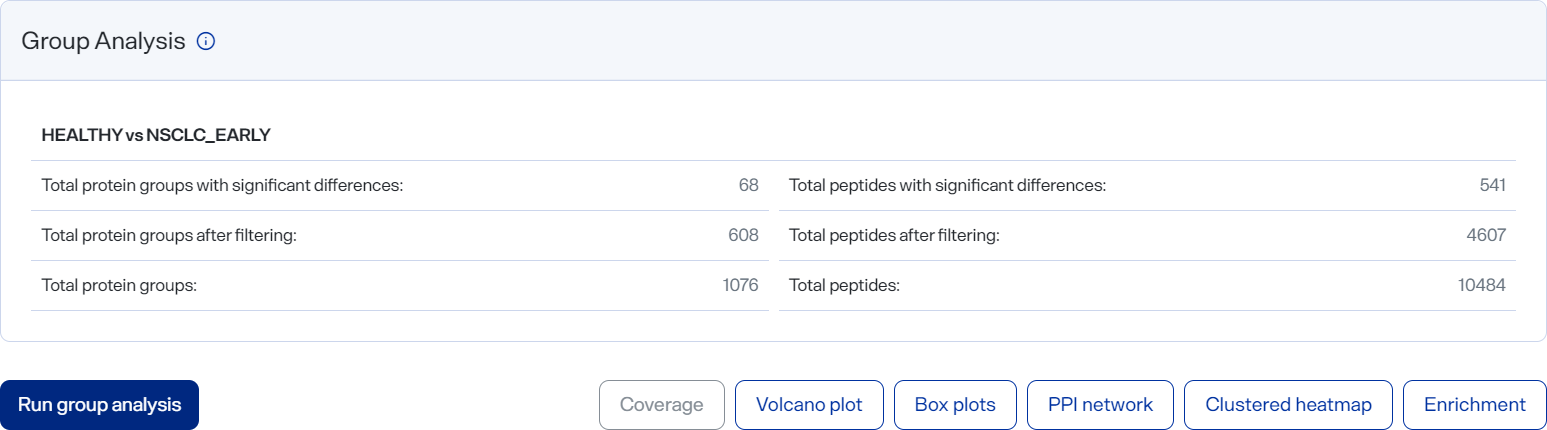
After a group analysis has completed, additional toolbar buttons appear to show visualization graphs:
-
Coverage — (Available when at least two proteins are selected in the Data panel.) Select to view the Coverage graph. Visualize the amino acid sequence of your selected protein and the regions where measured peptides map. Coverage is represented as a percent (%) of sequence observed by measured peptides.
-
Volcano Plot — Select to view the Volcano plot. Visualize a scatterplot showing the statistic significance (P value) in abundance differences between your compared groups versus the magnitude of the change (Fold Change).
-
Box Plots — (Available only for significant proteins.) — Select to view the Box Plots graph. Visualize the intensity differences between groups of significantly different proteins.
-
PPI Network — (Available only for significant proteins.) — Select to view the PPI Network graph. Visualize a network plot showing protein-protein interactions between proteins with significantly different abundances between compared groups.
-
Clustered Heatmap — Select to view the Clustered Heatmap graph. Visualize protein abundances across samples, with both proteins (rows) and samples (columns) clustered based on algomerative nesting.
-
Enrichment — (Available only for significant proteins.) — Select to view the Enrichment graph. Functionally characterize proteins showing abundance differences between conditions compared, by performing gene ontology (GO) term enrichment.