Data panel
The Data panel shows a table consisting of protein groups or peptides (rows) identified across the analyzed samples (columns) and their corresponding intensity levels (values).
To view the Data panel:
-
On the Analyses page, select an analysis from the list and scroll to the Data panel.
The Data panel replaces the results table formerly in the group analysis panel. It displays some of the same content as was displayed in the group analysis results table, but now also displays additional columns.
The Data panel information changes based on your actions within the analysis:
-
When you load a completed analysis, the associated Data panel shows the results of the analysis run.
-
If you run a group analysis of the analysis, the Data panel includes the results of the group analysis.
-
If you have multiple group analyses for that analysis, the Data panel displays the data of the most recently viewed group analysis.
Samples for which a protein group or peptide was detected show a numerical value. However, samples for which a protein group or peptide was not detected show a hyphen - character.
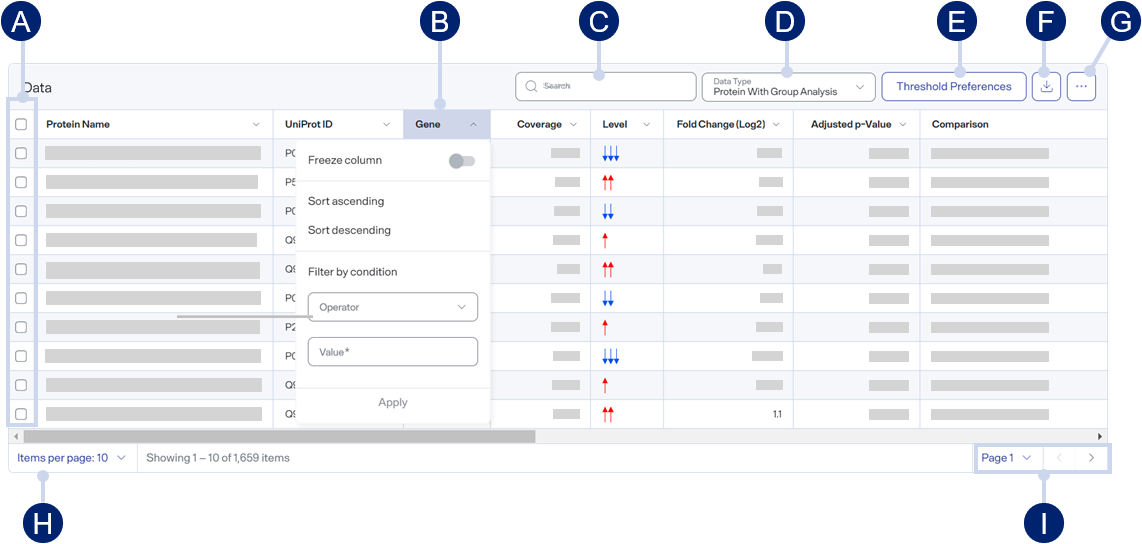
Data panel from the Analysis Results tab (after a group analysis)
-
Selection boxes — Select the box in the title row to select all rows in the table. Select it again to clear all checkboxes.
Select a box in front of the row you want to select. You can select multiple rows -
Column controls — Select a column header to view a menu that allows you to sort and filter the column values.
-
Search — Enter text and press Return to search for text or values in the data table.
-
Data Type— Shows the current selection for the table. If no group analysis has been run for this analysis, then you'll see Peptide or Protein. Once a group analysis is performed, the label is appended with With Group Analysis, additional columns display, and the data includes results from the group analysis.
-
Threshold Preferences — Select to set threshold preferences (e.g., High Regulation Threshold). The high and medium threshold values indicate when a value will be flagged as high (three up arrows) or medium (two up arrows). The graph values will re-draw the dashed lines on the graph according to these values.
-
Download button — Select to download the data files for offline analysis. You can download:
-
Tabulated Group Results: The results table output of proteomic search, including the output of a selected group analysis, if one has been performed
-
Processed Group Intensities: A matrix of intensity values with samples as columns and protein groups or peptides as rows. The intensity values are generated by the search analysis and are used in the group analysis statistical test. Any protein groups/peptides that were excluded by the missing value filters selected during the group analysis setup are not included in this download file.
-
Processed Group Intensities Long Form: A more detailed version of the Processed Group intensities, where each observation (Peptide Spectral Map) is stored in a single row along with identifiers for variable and value.
-
-
Menu — Select to show or hide columns in the Data panel. Required columns are grayed out. Optional columns are shown with a check box selected (displayed) or a cleared check box (idden).
-
Items to show per page — Shows the number of items displayed on each page of the Data panel. Select to modify the number of items to display.
-
Page controls — Select a page number from the drop-down list to view a specific page or select the left-facing or right-facing arrows to view the previous or next page.