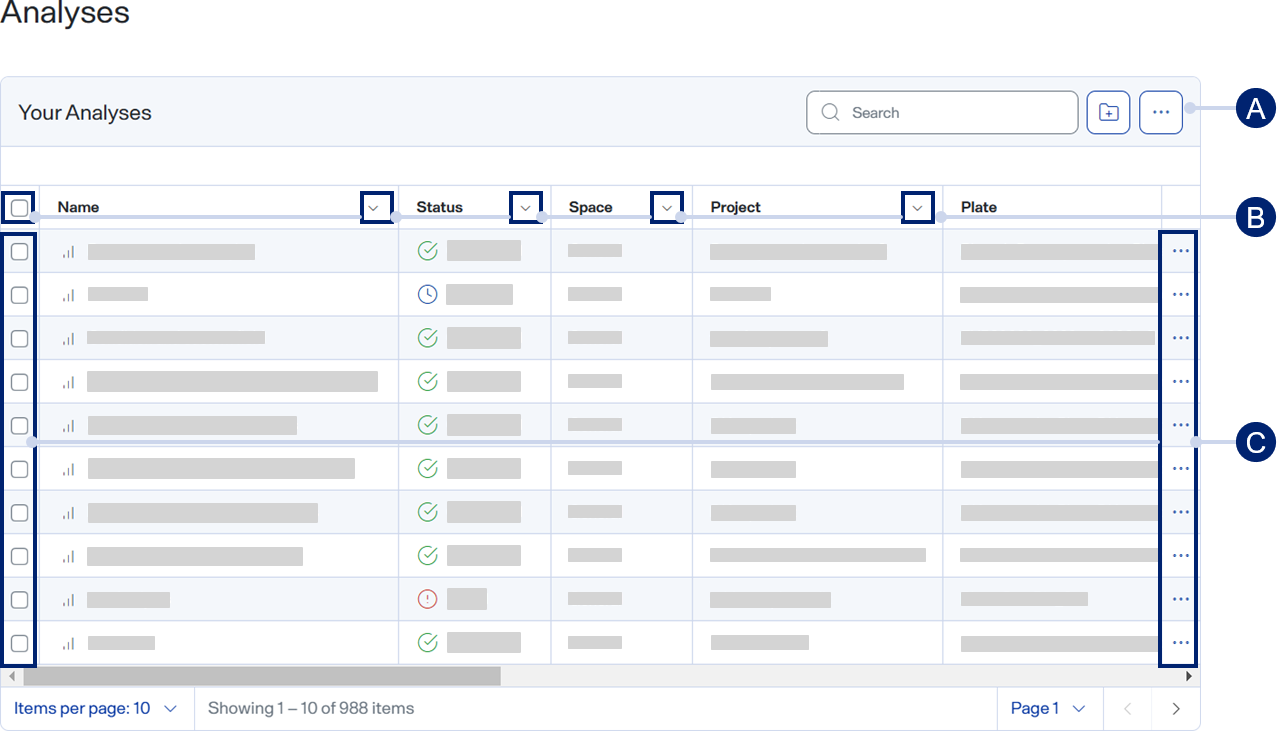
Analyses page
Use the Analyses page to manage analyses and to view and download analysis results and logs. To open this page, select ![]() Analyses on the sidebar menu.
Analyses on the sidebar menu.
-
Toolbar items
-
Column options
-
Row menu items
Toolbar items
-
 Search — Use to find a specific item.
 -
 Create folder and add files — Select to create a new folder into which you can organize analyses for the selected project. See Create a folder and add analyses to it.
 -
 > Display columns — Select or clear checkboxes to show or hide table columns.
 -
> Refresh table — Select to refresh the table.
Column options — Use these options to freeze columns, sort the table, and filter individually or together to show only certain table items.
Row menu items
-
>
 — Select to download an analysis log. See Download an analysis log.
 -
>
 — Select to move the analysis to a folder. See Add analyses to a folder.
 -
>
 — Select to edit information about the selected analysis. See Edit an analysis.
 -
>
 — Select to delete the selected analysis. See Delete one or more analyses.
After you select an analysis, the summary panel appears with data from the analysis.

The Summary panel menu options:
-
View analysis — Select to load the analysis and view analysis graphs.
-
Download results — Select to download the results. A download tray opens, showing the files that are downloading. You can cancel one or more downloads by selecting x next to the file name or Clear all.
-
Reanalyze — Select to set up a new analysis based on the current analysis. See Reanalyze an analysis.
The Summary panel shows the following information.
-
Study results summary
-
Number of samples — The number of samples analyzed.
-
Total number of protein groups across samples
-
Average number of protein groups across samples
-
Total number of peptides across samples
-
Average number of peptides across samples
-
-
Analysis setup
-
Analysis name — The name of the analysis.
-
Run Types — The analysis protocol type, such asDDA or DIA.
-
Analysis Protocol — The name of the analysis protocol applied to the analysis.
-