QC Charts tab
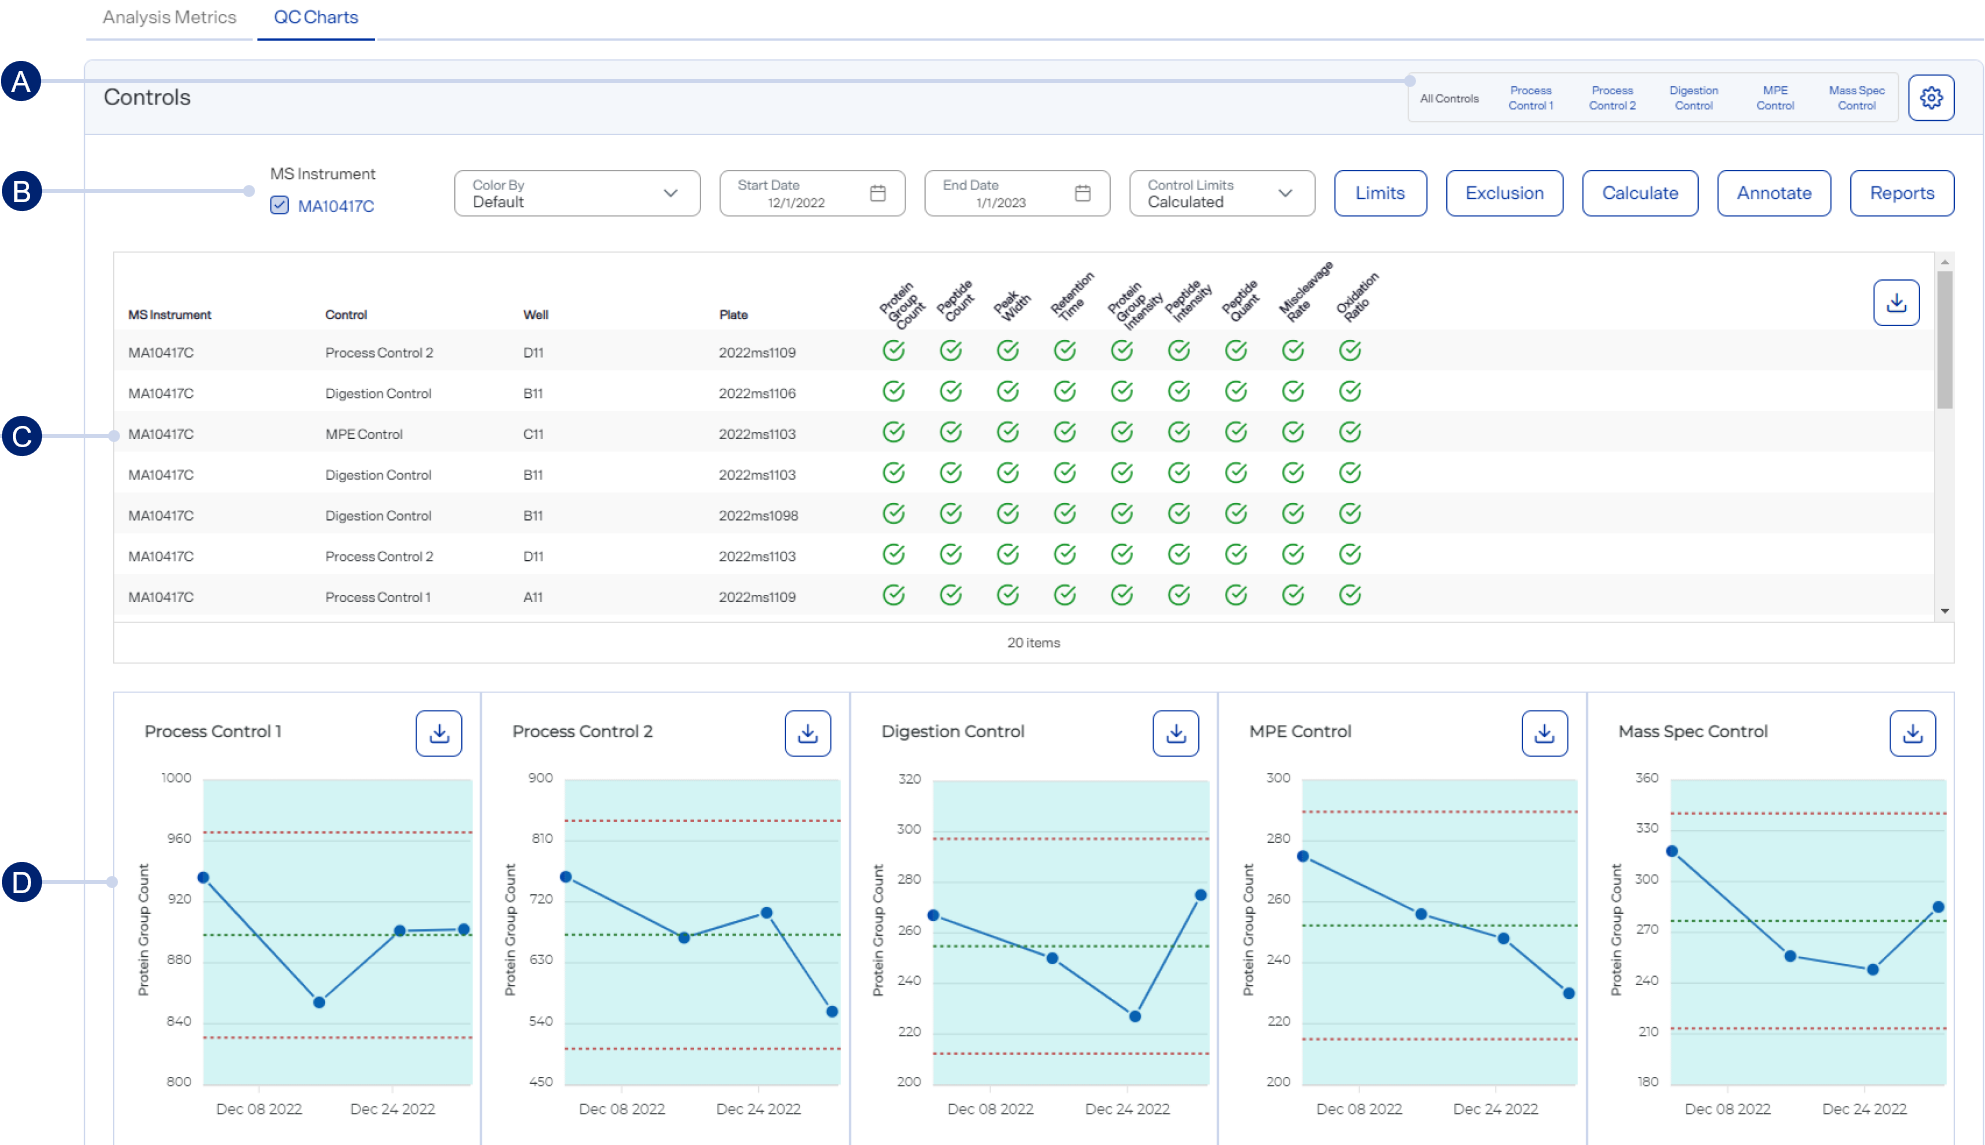
The QC Charts tab on the Analyses page shows assay control data for an analysis. Each chart plots one metric for one assay control category. Charts are organized in a grid, with the same metric across each row and the same control type down each column. The x-axis is labeled with the date of analysis and the y-axis depends on the metric.
Results
Results for controls
-
Filters for viewing charts for all controls or a selected control type
-
Toolbar with additional filters and functions
-
Summary of control data for the selected analysis time frame
-
QC charts with metrics of each control
Toolbar items
-
<control filters> — By default, all controls are included. Select another option to filter by a specific control type.
-
MS Instrument — The instruments listed vary depending on your organization. Select up to six instruments to aggregate their data.
-
Color By — (Available when only one MS instrumented is selected.) Select your preferred coloration for the graphs (e.g., Gradient).
-
Start Date — Enter or select the earliest date of data you want to see.
-
End Date — Enter or select the latest date of data you want to see
-
Control Limits — Select how you want control limits to be defined.
-
Preinstalled — Use the pre-installed control limits.
-
User Defined — Define your own control limits. See Manage user-defined and calculated control limits.
-
Calculated — Calculate control limits from data within one or more date ranges, which you define with the
 Calculate button (see below).
-
-
 Limits — (Available when Calculated is selected in the Control Limits list.) Select to view the calculated control limit date ranges. From here, you can also delete a range. See Manage user-defined and calculated control limits.
 -
 Exclusion — Select to exclude an outlier or other data point from the control limit calculation. Selecting one data point (sample) in a plot excludes the corresponding sample from the other plots. A well containing the mass spec control has 10 reported QC metrics. All other control wells have 11 reported QC metrics. See Manage user-defined and calculated control limits.
 -
Calculate — Select to define a calculated control limit based on a range of dates. See Manage user-defined and calculated control limits.
-
 Annotate — Select to annotate all control charts for a specific date. See Annotate control charts.
 -
 Reports — Select to generate a PDF report of control results, with specific criteria. See Generate a detailed PDF report of control results.
How to use
For additional usage instructions, see Open and filter an analysis’s QC Charts tab.
-
To jump to a specific control chart, select its status icon (e.g.,
 ) in the summary table above the control charts.
 -
Hover over a dot on a control chart to view general information about a control, such as well and plate.
-
Select
 button") Settings to customize the graph. See Set QC Charts preferences.
Settings to customize the graph. See Set QC Charts preferences.Style the graph to include the information you want before downloading it as an image file. The graph reverts to its default settings each time the page loads.
-
Download a graph as an image file by selecting an image option from the
 Download on the graph.