Open and filter an analysis’s QC Charts tab
Follow these steps on the Analyses page to open an analysis’s QC Charts tab and filter the results by control type and/or time frame.
-
On the sidebar menu, select
 Analyses to open the Analyses page.
 -
(Optional) From the Status list, select Completed and then select Apply to show only completed analyses in the table.
-
From the Controls/Samples list, select Controls included and then select Apply to limit the view to analyses that include controls.
-
Select the checkbox of a single analysis to load its data.
-
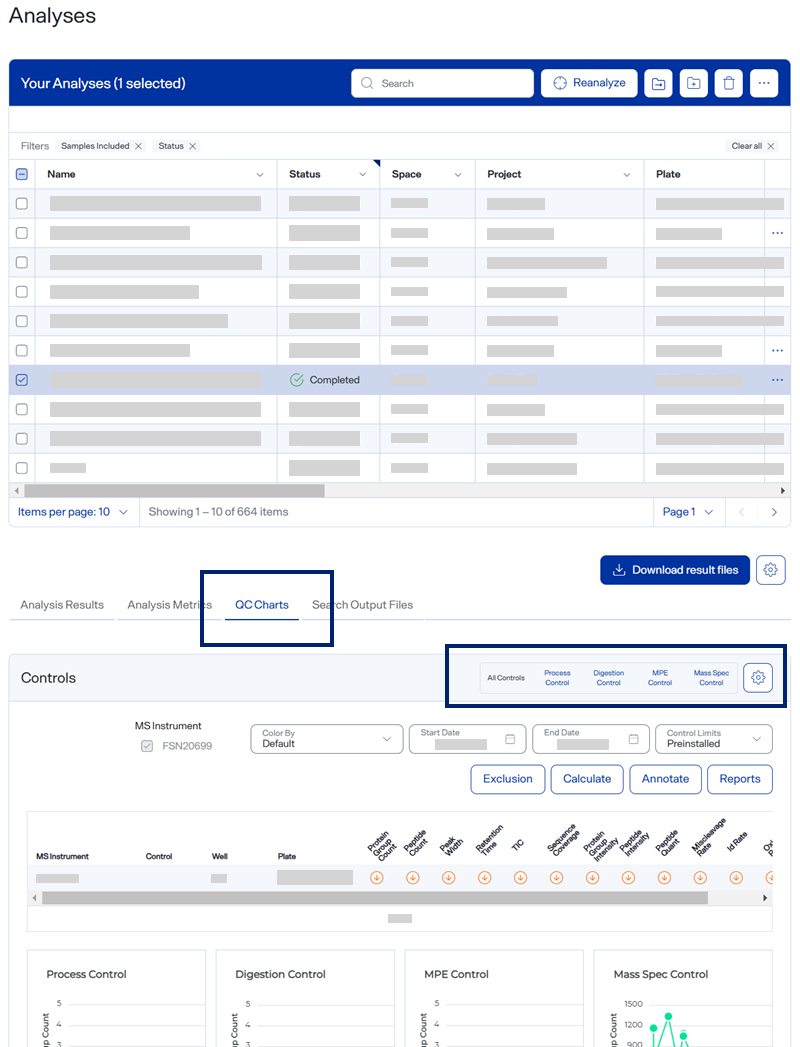
Select the QC Charts tab.
The QC Charts tab presents each control with metrics for assay and MS performance.
A selected analysis QC Charts tab with MS Instruments selections
-
Under MS Instrument, select up to six instruments.
The tab aggregates data from the selected instruments and hides the Color By menu.
-
To filter the results for a specific control type, select an option:
-
All Controls — Shows results for all controls.
-
User Control — Results for user controls only.
-
Cleanup Particles Control — Results for Cleanup Particles Control only.
-
-
To filter results for a specific time frame, enter the MS injection time frame in the Start Date and End Date fields.