View group analysis results
The Group Analyses panel (on the Analyses page) shows the analysis configuration summary and results from comparing two user-defined groups, organized into sections. You can visualize differences in proteins detected between the groups and explore initial biological insights into the data.
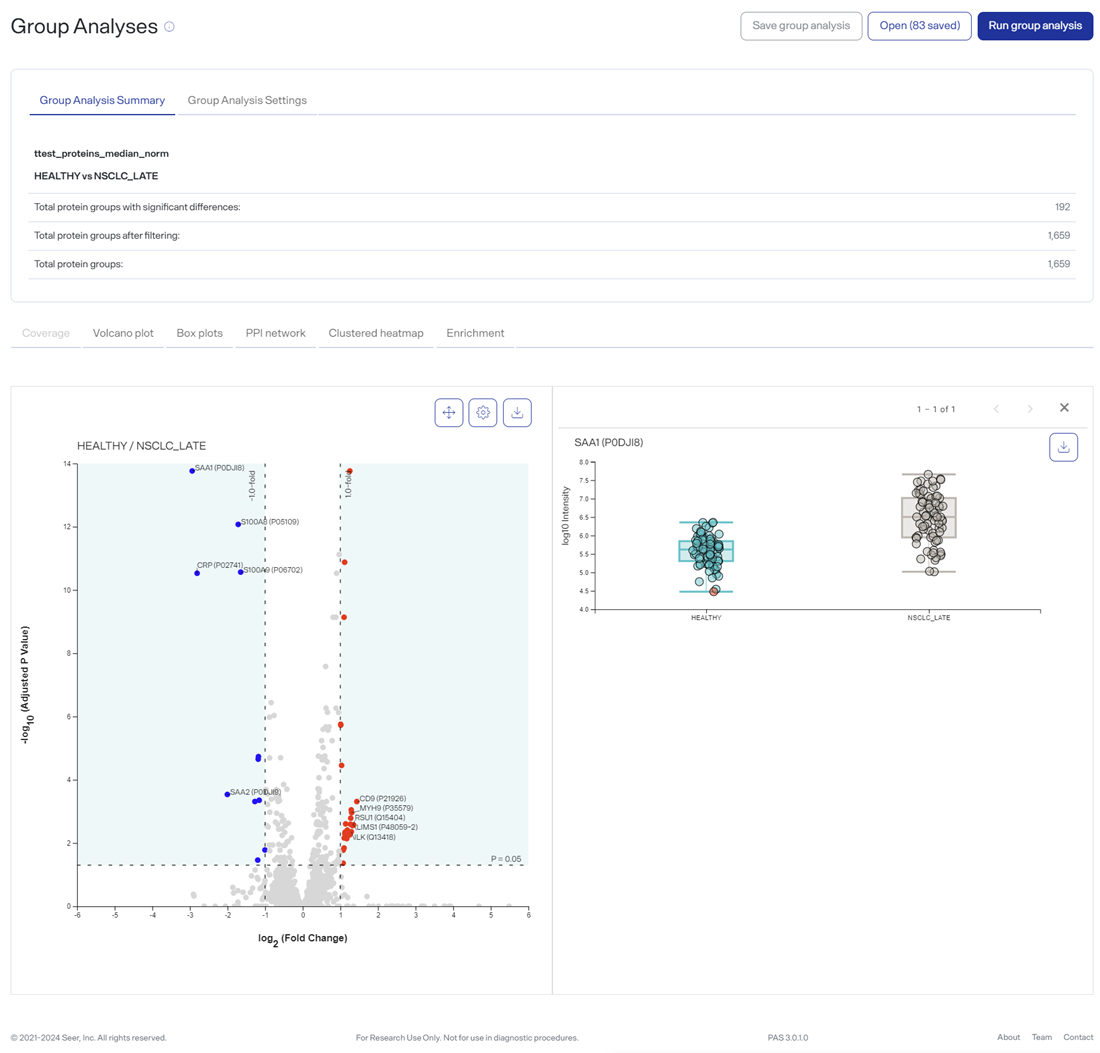
In addition to the summary and settings, the Group Analyses panel includes visualization graphs that you can view, examine details, and export. For more information, see Group analysis plots and graphs.
The Group Analyses panel, with data loaded